
Now, the way the chart is set up, it seems to indicate that, if a country spends more on certain social welfare projects, it will experience a higher employment rate as a result. However, the chart itself notes that "spending on child care, preschool and elder care correlates with higher proportions of adults working" (emphasis added). However, it does not indicate that they are necessarily related in any way other than happening to experience similar trends.
Wikipedia has a decent illustration of the relationship between two events:
- A causes B; (direct causation)
- B causes A; (reverse causation)
- A and B are consequences of a common cause, but do not cause each other;
- A causes B and B causes A (bidirectional or cyclic causation);
- A causes C which causes B (indirect causation);
- There is no connection between A and B; the correlation is a coincidence.
So, while some people take the chart above to be an example of 1, it may be an example of 2 (higher employment rates equal more public spending on social welfare), 3 (some other force in society drives up both employment rates and spending), 4 (increases in one causes increases in the other, and vice-versa), 5 (increased spending causes more need of workers in social welfare industries, driving up employment), or 6 (the two happen to rise together at this point in time, but are entirely unrelated). Obviously, there can be gradations here, such that small amounts of spending indicate large amounts of job creation, but that is a difference of degree of causation.
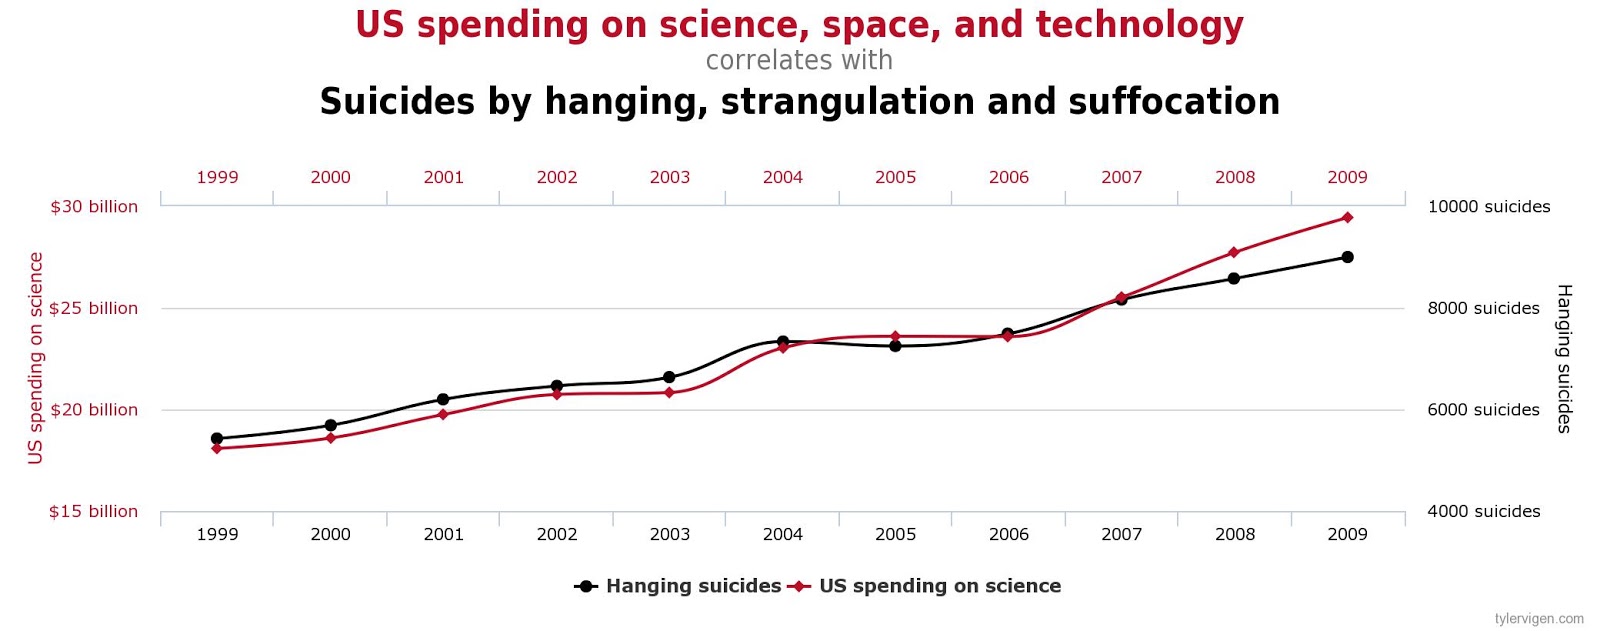
One statistician (and soon to be lawyer?), Tyler Vigen, created a website - Spurious Correlations - that indicates the problems with automatically substituting causation for correlation. Some of his more interesting creations include:
U.S. Spending on Science, Space, and Technology correlates with Suicides by Hanging, Strangling, and Suffocation:
or more fun: Sunlight in Indiana correlates with Visits to Universal Orlando Universal Studios:

Mr. Vigen includes a generator (wherein I created the lower chart) where you can make your own correlative comparisons...such as the following, which is a nearly perfect correlation...but who among you will claim the two are causally related?

So, when viewing claims by politicians, interest groups, neighbors, friends, random statisticians, economists, etc., it is always wise to read the chart carefully, and to read the description of the chart and the language of the proponent and ensure that you ask how and why the two correlate. If the answer is, "The data does not lie," without more, then you are being asked to fill in the causal mechanism using your own preferences and prejudices, replacing the work of science and mathematics that must go on to prove true causation.
No comments:
Post a Comment